Note
Go to the end to download the full example code.
Create a database#
This example shows how to use PyDynamicReporting to create an Ansys Dynamic Reporting service, create a database for this service, and create items in this database.
Note
This example assumes that you have a local Ansys installation.
Start an Ansys Dynamic Reporting service#
Start an Ansys Dynamic Reporting service with a new database. The path for the database directory must be to an empty directory.
import numpy as np

import ansys.dynamicreporting.core as adr

ansys_loc = r"C:\Program Files\ANSYS Inc\v232"
db_dir = r"C:\tmp\new_database"
adr_service = adr.Service(ansys_installation=ansys_loc, db_directory=db_dir)
session_guid = adr_service.start(create_db=True)
Create items#
Now that an Ansys Dynamic Reporting service is running on top of the new database, create some items of different types (text, image, and 3D scene) in the database. The payload for these items comes from files on disk.
my_text = adr_service.create_item()
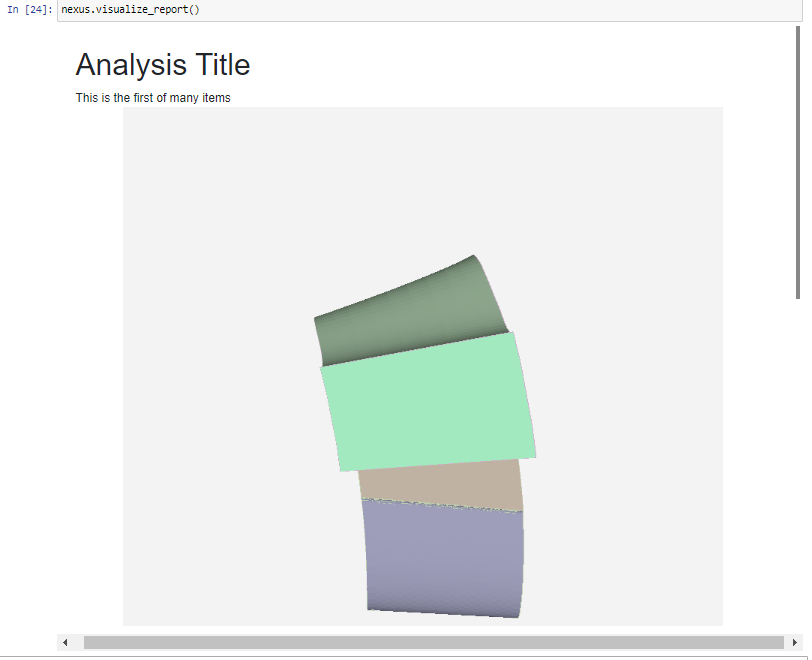
my_text.item_text = "<h1>Analysis Title</h1>This is the first of many items"
my_image = adr_service.create_item()
my_image.item_image = r"""D:\tmp\tmp_img.png"""
my_scene = adr_service.create_item()
my_scene.item_scene = r"""D:\tmp\tmp_scene.avz"""
Visualize all items#
Visualize all items currently in the database by invoking the default report, which is simply the list of items, one after the other. If you are running inside a Python interpreter such as Jupyter Notebook, the visualization is embedded in the web page. If not, a browser opens an HTML page that displays the default report.
adr_service.visualize_report()
Create tables and trees#
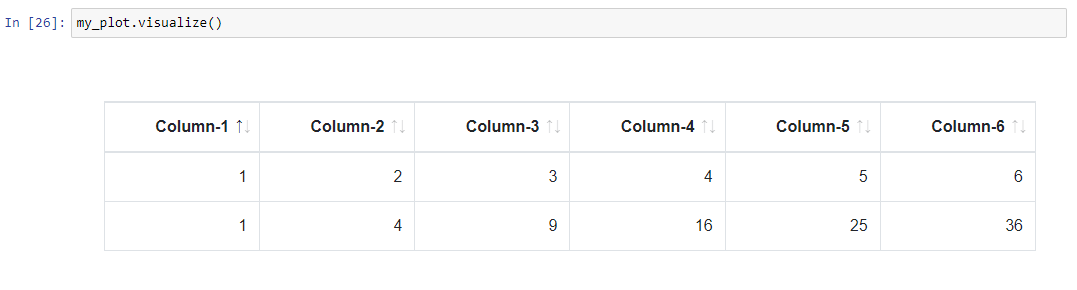
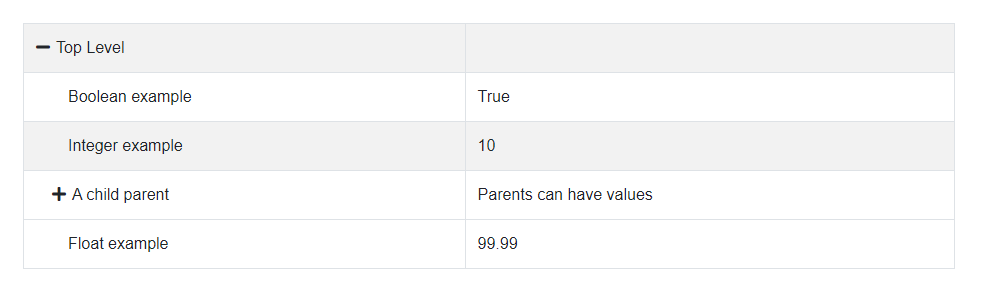
Table and plot items can be generated by passing a numpy array. Trees are represented via Python dictionaries. All the different options for tables and trees can be set here.
my_plot = adr_service.create_item()

my_plot.item_table = np.array([[1, 2, 3, 4, 5, 6], [1, 4, 9, 16, 25, 36]], dtype="|S20")
my_plot.labels_row = ["First Row", "My Second Row"]

leaves = []
for i in range(5):
    leaves.append({"key": "leaves", "name": f"Leaf {i}", "value": i})
children = []
children.append({"key": "child", "name": "Boolean example", "value": True})
children.append({"key": "child", "name": "Integer example", "value": 10})
children.append(
    {
        "key": "child_parent",
        "name": "A child parent",
        "value": "Parents can have values",
        "children": leaves,
        "state": "collapsed",
    }
)
children.append({"key": "child", "name": "Float example", "value": 99.99})
tree = []
tree.append(
    {"key": "root", "name": "Top Level", "value": None, "children": children, "state": "expanded"}
)
my_tree = adr_service.create_item(obj_name="My Tree object")
my_tree.item_tree = tree
Visualize tables and trees#
You can visualize single items as web components, similarly to how you
visualized the default report. Simply calling the
visualize method
on each of the single items.
my_plot.visualize()
my_tree.visualize()
Close the service#
Close the Ansys Dynamic Reporting service. The database with the items that were created remains on disk.
# sphinx_gallery_thumbnail_path = '_static/00_create_db_0.png'
adr_service.stop()