Note
Go to the end to download the full example code.
Multiple simulations in same database#
Use a single database and report template for multiple simluation results.
Note
This example assumes that you have a local Ansys installation.
Start an Ansys Dynamic Reporting service#
Start an Ansys Dynamic Reporting service with a new database. The path for the database directory must be to an empty directory.
from random import random as r

import numpy as np

import ansys.dynamicreporting.core as adr
from ansys.dynamicreporting.core.utils import report_utils

# Find a random open port for the ADR service
adr_port = report_utils.find_unused_ports(1)[0]
adr_service = adr.Service(
    ansys_installation=r"C:\Program Files\Ansys Inc\v241",
    db_directory=r"D:\tmp\new_db",
    port=adr_port,
)
session_guid = adr_service.start(create_db=True)
Set methods for items and report template creation#
Define two methods: one to create items associated with a design point simulation, and a method to create the report template for a simulation report. The first method to create items is mocking what a real simulation would produce: a set of items pushed directly into the database. Please note that each item is tagged with the corresponding design point.
def create_items(dp=0) -> None:
    intro_text = adr_service.create_item()
    intro_text.item_text = "This section describes the settings for the simulation: initial conditions, solver settings, and such."
    intro_text.set_tags(f"dp=dp{str(dp)} section=intro")

    intro_tree = adr_service.create_item()
    mytree = []
    mytree.append({"key": "root", "name": "Solver", "value": "My Solver"})
    mytree.append({"key": "root", "name": "Number cells", "value": 10e6})
    mytree.append({"key": "root", "name": "Mesh Size", "value": "1.0 mm^3"})
    mytree.append({"key": "root", "name": "Mesh Type", "value": "Hex8"})
    intro_tree.item_tree = mytree
    intro_tree.set_tags(f"dp=dp{str(dp)} section=intro")

    data_table = adr_service.create_item()
    ics = []
    ips = []
    zet = []
    for i in range(30):
        ics.append(i / 5.0)
        ips.append(np.sin((i + 6 * dp) * np.pi / 10.0) + r() * 0.1)
        zet.append(np.cos((i + 6 * dp) * np.pi / 10.0) + r() * 0.1)

    data_table.item_table = np.array([ics, ips, zet], dtype="|S20")
    data_table.labels_row = ["X", "Sin", "Cos"]
    data_table.set_tags(f"dp=dp{str(dp)} section=data")
    data_table.plot = "line"
    data_table.xaxis = "X"
    data_table.yaxis = ["Sin", "Cos"]
    data_table.xaxis_format = "floatdot0"
    data_table.yaxis_format = "floatdot1"
    data_table.ytitle = "Values"
    data_table.xtitle = "X"


def create_report_template(server=None) -> None:
    template_1 = server.create_template(
        name="Simulation Report", parent=None, report_type="Layout:basic"
    )
    template_1.params = '{"HTML": "<h1>Simulation Report</h1>"}'
    server.put_objects(template_1)

    template_0 = server.create_template(name="TOC", parent=template_1, report_type="Layout:toc")
    template_0.params = '{"TOCitems": 1, "HTML": "<h2>Table of Content</h2>"}'
    template_0.set_filter("A|i_name|eq|__NonexistantName__;")
    server.put_objects(template_0)
    server.put_objects(template_1)

    template_2 = server.create_template(
        name="Introduction", parent=template_1, report_type="Layout:panel"
    )
    template_2.params = '{"HTML": "<h2>Introduction</h2>", "properties": {"TOCItem": "1"}}'
    template_2.set_filter("A|i_tags|cont|section=intro;")
    server.put_objects(template_2)
    server.put_objects(template_1)

    template_3 = server.create_template(name="Text", parent=template_2, report_type="Layout:basic")
    template_3.params = '{"properties": {"TOCItem": "0"}}'
    template_3.set_filter("A|i_type|cont|html,string;")
    server.put_objects(template_3)
    server.put_objects(template_2)
    server.put_objects(template_1)

    template_4 = server.create_template(name="Tree", parent=template_2, report_type="Layout:basic")
    template_4.params = '{"properties": {"TOCItem": "0"}}'
    template_4.set_filter("A|i_type|cont|tree;")
    server.put_objects(template_4)
    server.put_objects(template_2)
    server.put_objects(template_1)

    template_5 = server.create_template(
        name="Results", parent=template_1, report_type="Layout:panel"
    )
    template_5.params = (
        '{"HTML": "<h2>Results</h2>\\nYour simulation results.", "properties": {"TOCItem": "1"}}'
    )
    template_5.set_filter("A|i_tags|cont|section=data;")
    server.put_objects(template_5)
    server.put_objects(template_1)
Create items and report template#
Assume we have ran the design point dp0. Create the items. Check if the
database already contains the report template with the method
get_list_reports.
If it doesn’t exist, then create it as well.
create_items(dp=0)
if "Simulation Report" not in adr_service.get_list_reports():
    create_report_template(server=adr_service.serverobj)
Create items from second simulation#
Now assume we separately ran the design point dp1. Connect to the currently running ADR service and push the new items in the same database. Check if the report template already exists and create it only if it does not.
new_service = adr.Service(ansys_installation=r"C:\Program Files\Ansys Inc\v241")
new_service.connect(url=adr_service.url)
create_items(dp=1)
if "Simulation Report" not in new_service.get_list_reports():
    create_report_template(server=new_service.serverobj)
Visualize the report#
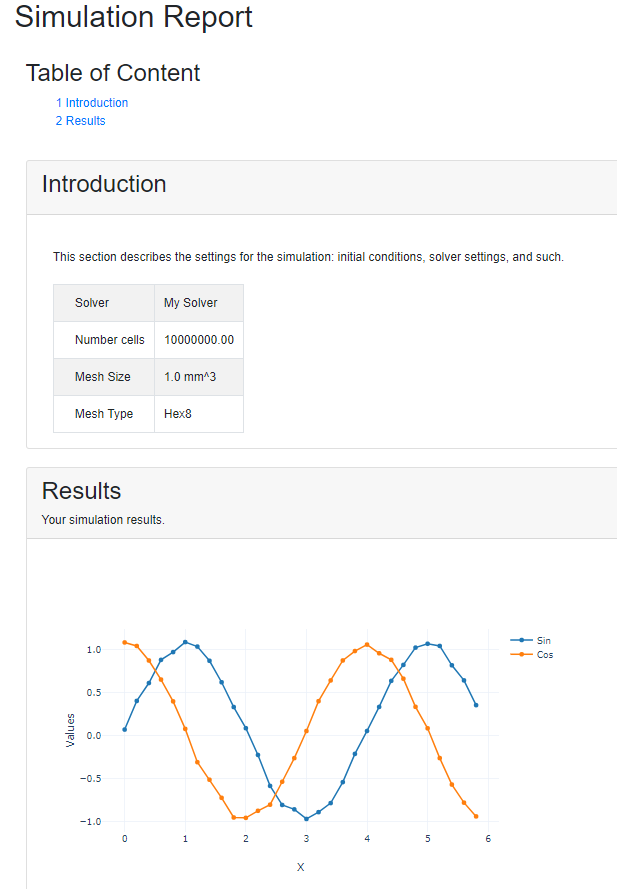
Now the database contains data from both design point simulations. If you were to simply visualize the report, both simulation results would appear. To avoid that, use a filter to downselect the items to visualize each time. Setting the filter to look only at items with tag dp=dp0 will show the report for the first design point. Similarly, filter for tag dp=dp1 will display the report for the second design point.
new_service.visualize_report(report_name="Simulation Report", item_filter="A|i_tags|cont|dp0;")
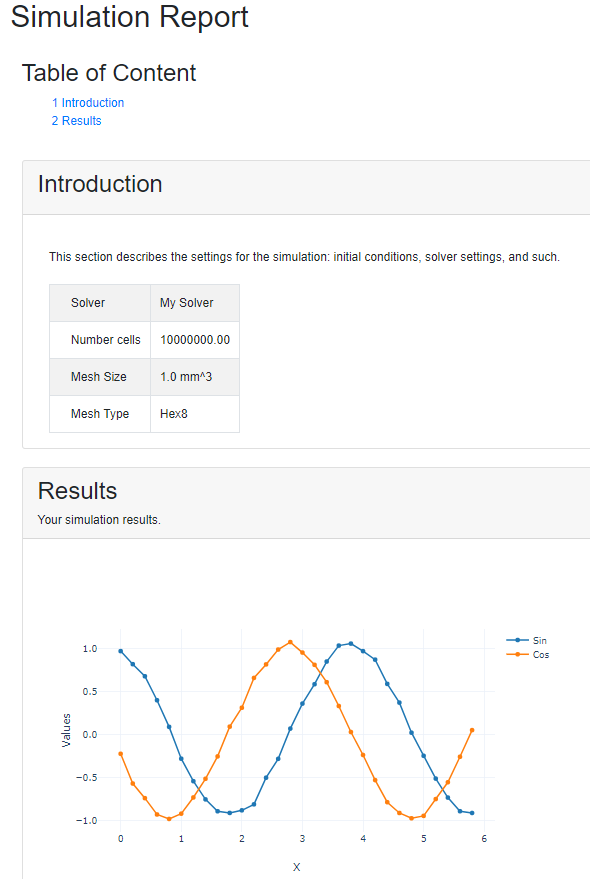
Visualize the report for dp1#
Visualize the report for the second design point. See how you only need to change the filter.
new_service.visualize_report(report_name="Simulation Report", item_filter="A|i_tags|cont|dp1;")
Close the service#
Close the Ansys Dynamic Reporting service. The database with the items that were created remains on disk.
# sphinx_gallery_thumbnail_path = '_static/01_two_simulation_same_db_0.png'
adr_service.stop()